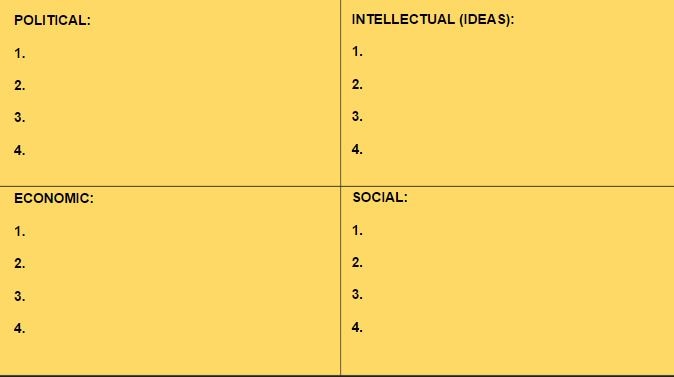
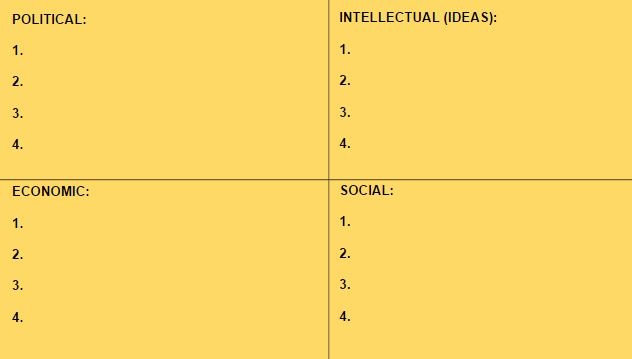
A PIES chart is a very versatile application for social and historical analysis. Feel free to create your own PIES chart about any topic and submit it to me for 25 points extra credit. Please make sure your observations are full sentences.
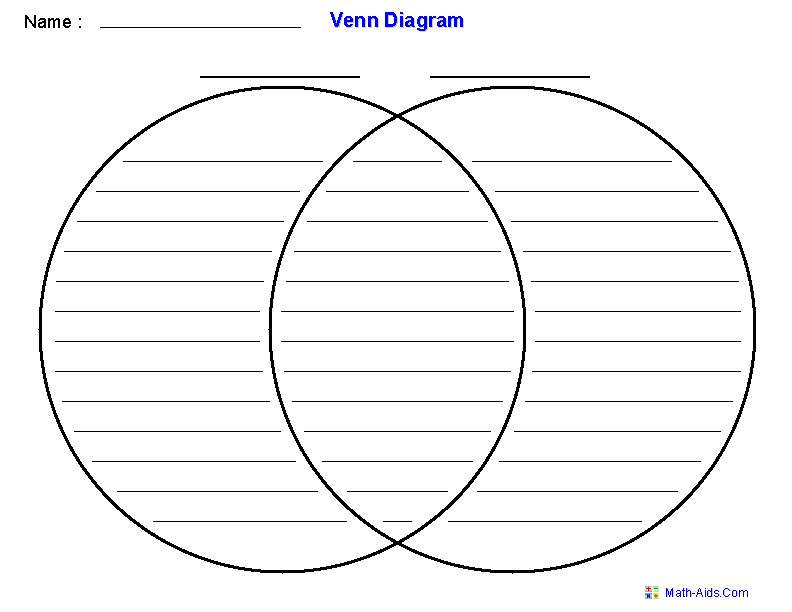
The old school Venn diagram. Where would we be without it? A Venn diagram is especially useful for comparing and contrasting 2 ideas, movements, people, places, or time periods. Again please feel free to submit a Venn diagram on any 2 places, things, ideas, or people for 25 points extra credit. Your work should include at least 5 full sentence details for each quadrant.
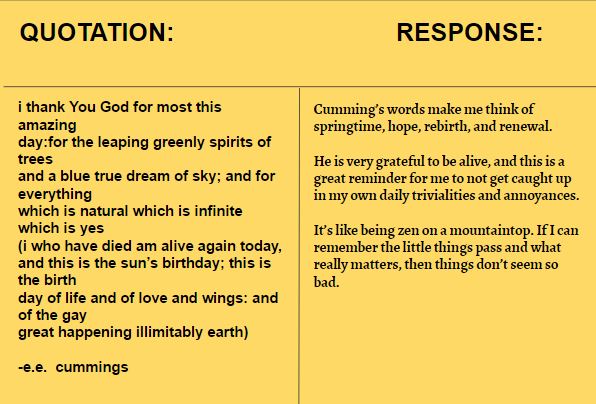
A quotation/response journal is an excellent way of annotating and engaging with a text. The quotation from the text goes on the left, and your response to the text goes on the right. (Extra credit opportunity: find a piece of historical text or poetry, and create 5 quotation/response entries for 25 points extra credit.)
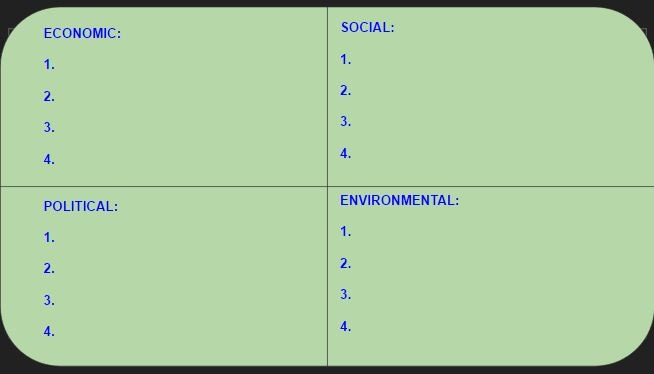
An ESPeN chart (Economic, Social, Political, Environmental) is an AP Human Geography based graphic organizer that I have adapted for use in multiple social studies courses. If you'd like to use an ESPeN chart for extra credit, the easiest way to do this is to choose a YouTube video on a relevant social topic (fracking, endangered wildlife, shantytowns in 3rd world countries, socio economic inequalities in the United States, etc), watch the video, then fill in full sentence observations for each relevant quadrant.
A PIES chart is a great tool for social, economic, and historical analysis. We will use PIES charts in class a great deal. For extra credit you can watch any of the embedded YouTube videos on this site, or another YouTube video of your choice. Fill out the PIES chart with complete sentences and submit for 30 points extra credit.
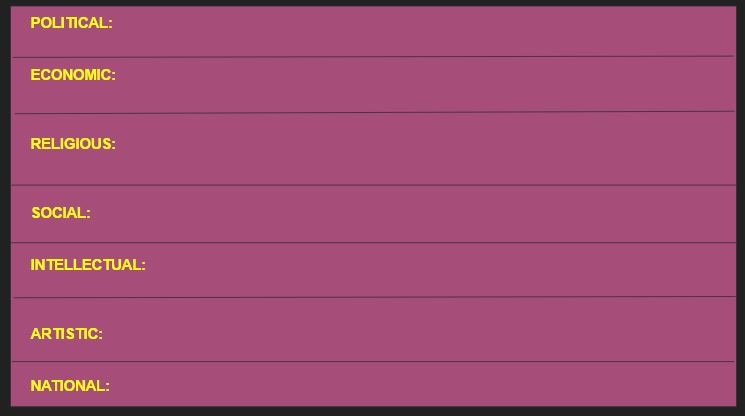
A PERSIAN chart is an AP style graphic organizer that is also highly versatile and useful. It is an inherently rigorous modality of thinking that really helps students deconstruct and unpack complicated historical texts and topics. I highly recommend it for use in any classroom environment.
Anchor chart:
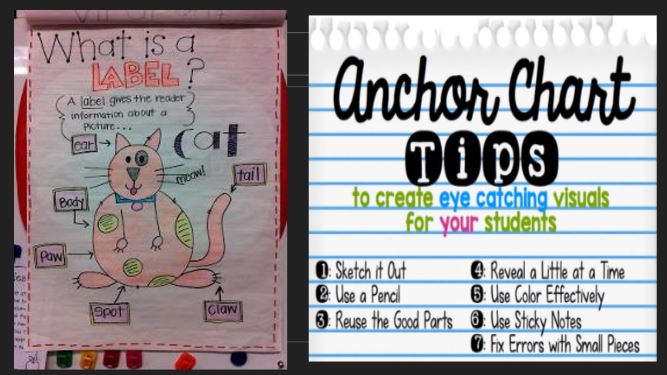
An anchor chart is a very engaging and rich way of showing your knowledge/mastery of a subject. Feel free to create a colorful and information-filled anchor chart for any of the topics or subjects on this web site.
Frayer model
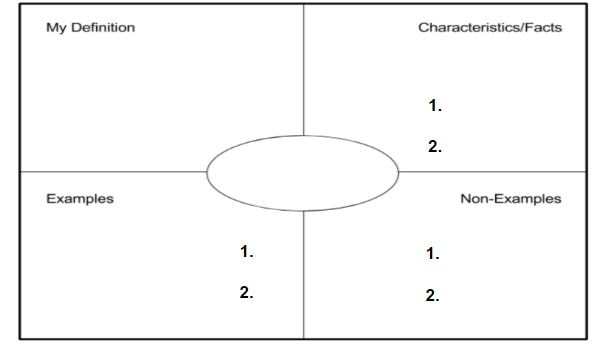
A Frayer model is another great and versatile tool for social studies. You can use it to explore a single vocabulary term (micro level) to an event or a time period in history (macro level.) Feel free to create one for 20 points extra credit.
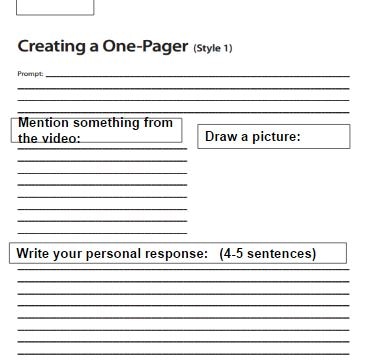
A 1 pager is an excellent tool to show your
knowledge or thinking about a particular subject.
For extra credit go ahead and create a 1 pager about any topic. It can be about you, another person, someone in your family, a friend, or someone we have studied about, or a historical person I might not know much about. (Extra credit: 25 points)
knowledge or thinking about a particular subject.
For extra credit go ahead and create a 1 pager about any topic. It can be about you, another person, someone in your family, a friend, or someone we have studied about, or a historical person I might not know much about. (Extra credit: 25 points)
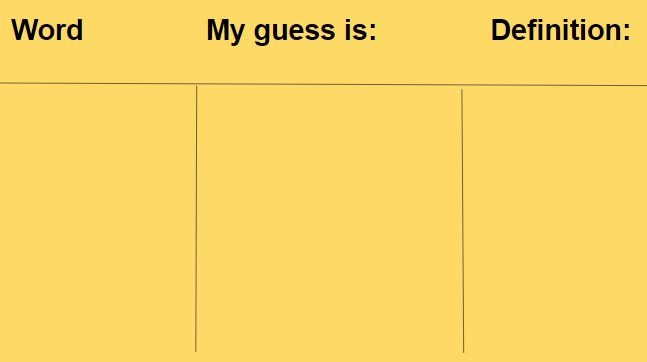
We will be using 3 column notes a lot in class. As we read primary and secondary source documents and other high level texts, 3 column notes will help you keep track of and understand difficult vocabulary. Make sure you keep about 9 or 10 pages in the back of your notebook for a dedicated 3 column notes section.